TradersCult.com
No Result
View All Result
TRADE NOW
  • Home
  • Brokers
  • Analysis
    • Technical Analysis
    • Fundamental Analysis
    • Strategies
  • Finance Basics
  • Crypto
  • Broker Finder
TradersCult.com
  • Home
  • Brokers
  • Analysis
    • Technical Analysis
    • Fundamental Analysis
    • Strategies
  • Finance Basics
  • Crypto
  • Broker Finder
TRADE NOW
No Result
View All Result
TradersCult.com
No Result
View All Result
Home Analysis Technical Analysis

Understanding Pivot Points

Traders Cult by Traders Cult
April 8, 2024
in Technical Analysis
0
Discovering Pivot Points
7
SHARES
163
VIEWS
Share on FacebookShare on Twitter

Chapters

Toggle
  • Unlocking Forex Market Dynamics: a Guide to Pivot Points
    • Understanding Pivot Points
    • How to Use Them
    • Conclusion

Unlocking Forex Market Dynamics: a Guide to Pivot Points

In the fast-paced world of forex trading, market participants are often in search of tools that can aid in making informed decisions. One such tool that has stood the test of time is the Pivot Point. P.P. serve as invaluable indicators, providing traders with key levels that can guide their strategies and enhance decision-making in the dynamic forex market.

You might also like

Technical Indicators: what is the Alligator

Bollinger Bands Indicator

Head And Shoulders Pattern – How it works and how to use it

Understanding Pivot Points

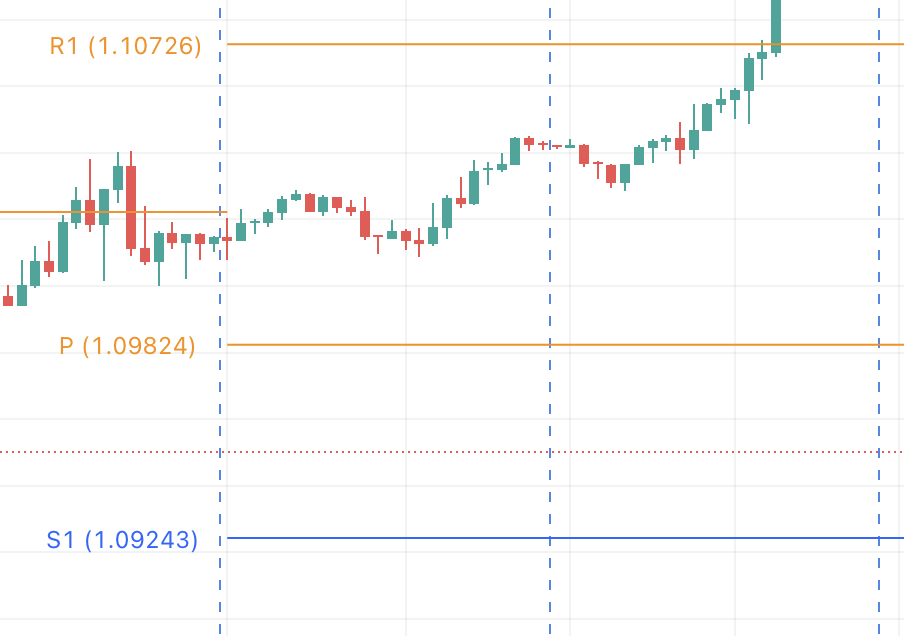
P.P. are a set of technical indicators used in technical analysis to identify potential reversal or continuation levels in the price movement of a financial asset, particularly in the forex market. These levels are derived from the previous day’s high, low, and closing prices. The primary idea behind Pivot Points is to identify key support and resistance levels that can influence market sentiment.

banner image

Calculation of Pivot Points:

The calculation of Pivot Points involves several components:

  1. Pivot Point (PP): PP=High+Low+Close3PP=3High+Low+Close​
  2. Support 1 (S1): S1=(2×PP)−HighS1=(2×PP)−High
  3. Support 2 (S2): S2=PP−(High−Low)S2=PP−(High−Low)
  4. Support 3 (S3): S3=Low−2×(High−PP)S3=Low−2×(High−PP)
  5. Resistance 1 (R1): R1=(2×PP)−LowR1=(2×PP)−Low
  6. Resistance 2 (R2): R2=PP+(High−Low)R2=PP+(High−Low)
  7. Resistance 3 (R3): R3=High+2×(PP−Low)R3=High+2×(PP−Low)


How to Use Them

  1. Identifying Support and Resistance:
    • Support Levels (S1, S2, S3): These levels are considered potential areas where the price might find buying interest.
    • Resistance Levels (R1, R2, R3): These levels are viewed as potential zones where selling interest may emerge.
  2. Market Sentiment:
    • If the current price is above the Pivot Point, it is often considered bullish sentiment.
    • If the price is below the Pivot Point, it might indicate bearish sentiment.
  3. Trading Strategies:
    • Bounce Trading: Traders may look for price bounces off Pivot Points as potential entry points.
    • Breakout Trading: A decisive move above or below a Pivot Point can signal a potential trend change or continuation.
  4. Combining with Other Indicators:
    • P. P. are often used in conjunction with other technical indicators to validate signals and enhance trading strategies.
  5. Timeframes:
    • Pivot Points can be calculated for various timeframes (daily, weekly, monthly), providing traders with flexibility to adapt to different market conditions.

Conclusion

Pivot Points have proven to be versatile tools for forex traders, offering insights into potential price levels where significant market activity may occur. While they are not foolproof, when used in conjunction with other analysis techniques, Pivot Points can contribute to a comprehensive trading strategy. Traders should remember that successful trading involves a combination of technical analysis, risk management, and a keen understanding of market dynamics. As with any tool, it is essential to practice and adapt this indicator to individual trading styles and preferences.

Share3Tweet2
Traders Cult

Traders Cult

Recommended For You

Technical Indicators: what is the Alligator

by Traders Cult
January 6, 2024
0
What is the alligator indicator

What is the Alligator? The Alligator indicator is a technical analysis tool used in trading to help identify trends and potential entry and exit points. It's named after...

Read more

Bollinger Bands Indicator

by Traders Cult
March 12, 2021
0
bollinger-bands-indicator-guide

Bollinger Bands Indicator Bollinger Bands indicator is a type of technical analysis tool designed for the sole purpose of trading stocks by John Bollinger in the 1980s. The...

Read more

Head And Shoulders Pattern – How it works and how to use it

by Traders Cult
March 5, 2021
0
Head-and-shoulders-trading-patttern

What is the head and shoulders trading pattern? It is often said that the most reliable reversal pattern is the Head and Shoulders trading chart pattern. This pattern...

Read more

Japanese Candlesticks and how they work

by Traders Cult
March 5, 2021
0
how japanese candlesticks work

What are Japanese Candlesticks? Before starting to talk about Japanese candlesticks it is worth making a brief introduction on the major trading chart types. A trading chart is a...

Read more
Next Post
Swing Trading guide, strategies, techniques, analysis

A Comprehensive Guide to Swing Trading: Strategies, Techniques, and Technical Analysis

Please login to join discussion

Suggested

Learn how to use the price crossover strategy

Price Crossover – Trading Strategies

January 4, 2024
Best Mining GPUs in 2021 from Traders Cult

Best Mining GPUs

May 11, 2021
how japanese candlesticks work

Japanese Candlesticks and how they work

March 5, 2021

Browse by Category

  • Affiliate Marketing
  • Analysis
  • Brokers
  • Crypto
  • Finance Basics
  • Fundamental Analysis
  • Strategies
  • Technical Analysis

Home

Privacy

Terms & Conditions

Risk Warning: Your capital might be at risk
This is for information purposes only and should not be considered as personal and/or investment advice and/or incentive to continue trading. We do not guarantee the accuracy, validity, timeliness, or completeness of any information or data made available and assume no liability as to any loss arising from any investment based on the content of this material
The financial products offered by the companies listed on traderscult.com carry a high level of risk and can result in the loss of all your funds. You should never invest money that you cannot afford to lose
CFDs are complex instruments and entail a high risk of losing money rapidly due to leverage.
72% of retail investor accounts lose money when trading CFDs with this provide.
You should consider whether you understand how CFDs work and whether you can afford to take the high risk of losing your money.

Welcome Back!

Login to your account below

Forgotten Password?

Retrieve your password

Please enter your username or email address to reset your password.

Log In

Add New Playlist

No Result
View All Result
  • Brokers
  • Analysis
  • Finance Basics
  • Crypto
  • Broker Finder
  • Contact Us