What is the head and shoulders trading pattern?
It is often said that the most reliable reversal pattern is the Head and Shoulders trading chart pattern. This pattern is used both by professional traders and beginner traders to analyze both the stock and Forex markets. The good thing about this chart pattern is that it interprets and helps traders set the profit targets and risk levels properly.
The inverse head and shoulders trading pattern is also a valuable chart pattern that can be used by a trader. The chart pattern adopts the same method of approach used by the normal formation with it facing downwards. The pattern can also be used in setting price targets and risk levels for both stocks and Forex markets.
In this article we’ll be looking at various sub-topics under the Head and Shoulders Chart pattern:
What is a Head and Shoulders trading pattern?
What is the Inverse Head and Shoulders pattern?
How to recognize Head and Shoulders patterns on forex and stock charts
Example
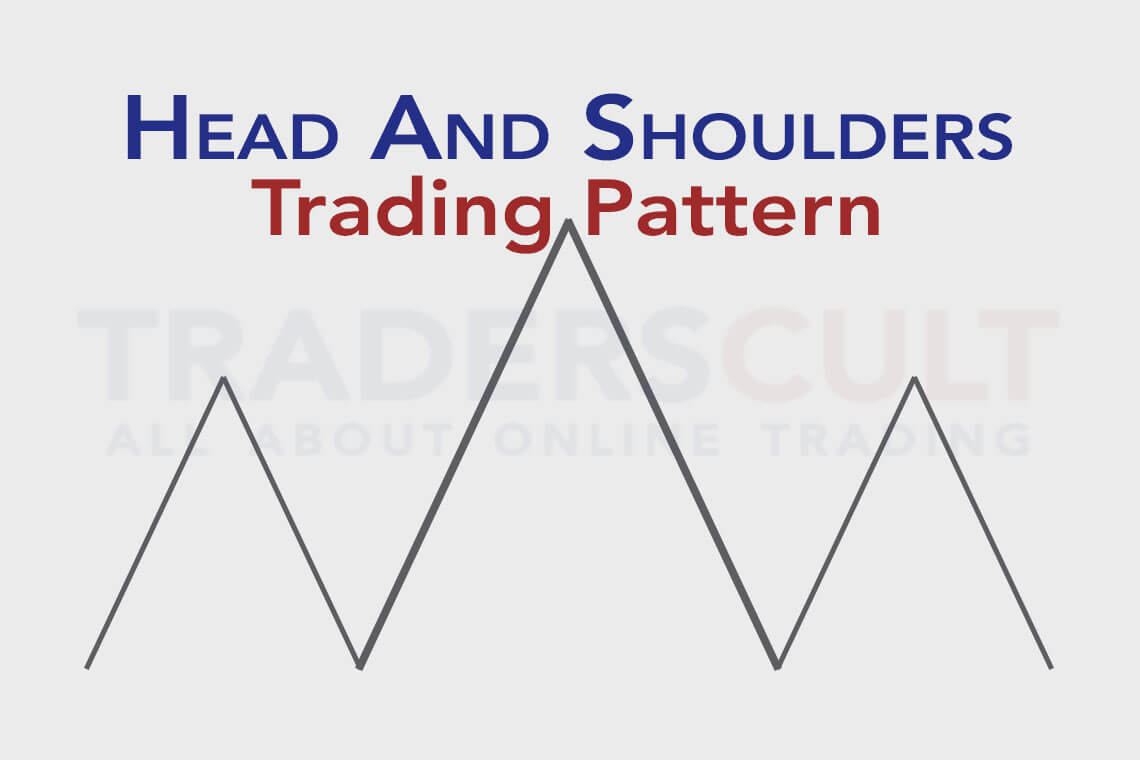
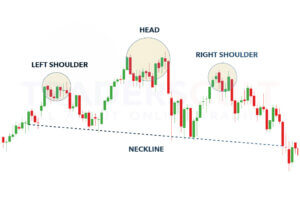
The Head and shoulders pattern is referred to as a price reversal formation that assists a trader in the identification of an impending price reversal after the exhaustion of a particular trend. This chart pattern indicates the end of a bullish trend. Just like the name suggests, the pattern looks just like a head and a shoulder. The formation comprises a left shoulder, head, right shoulder, and neckline.
The image below illustrates the formation of the figure.
What is the inverse head and shoulders pattern?
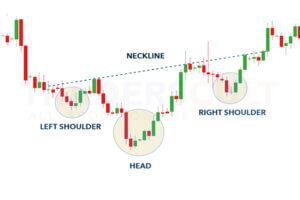
This pattern is also referred to as the reverse head and shoulders pattern. The inverse head and shoulders trading pattern has a similar structure to that of the traditional formation but in a reversed form. This chart pattern is seen in a bearish trend, and it signals the reversal of a downtrend as higher lows are being formed.
How to recognize Head and Shoulders on forex & stock charts
Identification of the head and shoulders chart pattern both on a Forex chart and a stock chart provides the same procedures and actions. This makes the pattern a good universal tool that should be incorporated in any trading strategy. Listed below is a quick explanation of how to properly identify the chart pattern.
- Specify the trend of the market, using technical indicators and price actions.
- Separate the formation of the head and shoulders chart.
- The space in between the head and shoulders should be as central as possible.
- Trace the neckline from the low point between the left and right shoulders.
These procedures can also be used in the identification of the inverse or reverse head and shoulders patterns.
How to trade it
Once a trader has fully grasped how to properly recognize a standard and inverse formation, it becomes quite easy to use it in technical analysis for both the stock and Forex markets.
Trading using the head and shoulders pattern
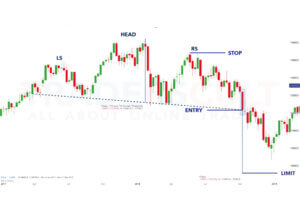
The above chart illustrates the head and shoulders pattern on the Germany 30 (DAX 30) stock index. The pattern structure is obvious with a highlighted neckline by the dashed blue horizontal line. Traders will go short after a close under the neckline is confirmed, as detected by the Entry tag on the chart, or when the pip is moved under the neckline. Many traders prefer to use the two-day close rule, which entails the confirmation of a second candle closing under the neckline before the place a short trade.
There is a common rule that helps in setting stop and limit levels. Picking the high point on the right shoulder will indicate the stop level, while the vertical distance between the high of the head and the neckline will give you the limit level. That’ll be 1832.8 pips according to the above chart. The risk-reward ratio for this trade is about 1:1.2 which still definitely corresponds with the adequate risk management rules.
Trading using the inverse formation
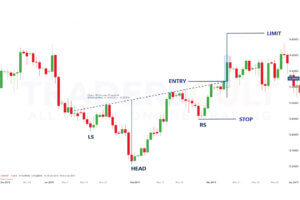 The above chart illustrates a USD/ZAR forex pair on an inverse head and shoulder pattern. The image shows an asymmetrical pattern which is normal with most formations. The neckline is narrowly uneven, but it still retains the quality of the pattern.
The neckline break pinpoints the long entry-level; it can also be specified by the price candle closing on top of the neckline. The stop loss is gotten from the right shoulder while the limit level is gotten by estimating the distance between the head low and the neckline.