Trade using Moving Averages Crossover Strategy
Moving Averages Crossover strategy is suitable also for beginners and it differs from the Price Crossover strategy explained in another post. Try this strategy on your Demo account before risk your real money.
Requirements
What you need to apply the Moving Averages Crossover Strategy is:
- Candlestick Chart
- 1 Moving Average Weighted – 12 period
- 1 Moving Average Weighted – 6 period
Additional Indicators
- ADX
- Pivot Points
- Bollinger Bands
Moving Averages Crossover Settings
Overlay on your charts, with daily timeframe, a shorter term Moving Average Weighted set to 6 periods and a longer term Moving Average Weighted set to 12 periods.
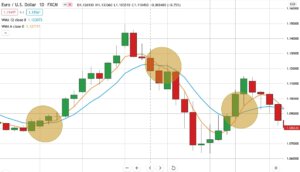
The Buy signal is given by the crossing of the “fast” Moving Average with the “slow” Moving Average, which in this case occurs when the fast Average crosses the slow one from the bottom upwards.
The Sell signal instead is when the “fast” Moving Average crosses the “slow” one from top to bottom.
The image below shows both types of signals. But keep in mind that invest following the trend is always the best idea. As the rule says: trend is your friend.
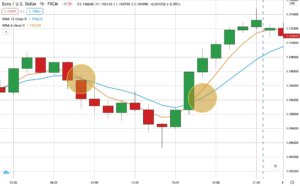
It is advisable to enter the market once the cross happens using longer timeframes as Daily or Weekly. While using shorter timeframes we suggest to wait that the candle closes once the crossover is completed. You can see the example below using H1 timeframe:
Recommendations
It is also advisable to find a complete cross of the Moving Averages Weighted.
Fix Take Profit and Stop Loss levels supported by daily Pivot Points, ADX set with the “Smoothing” to 6 periods and the “DI Length” to 12 periods, in addition the Bollinger Bands at 24 periods and a Standard deviation to 2.
It is strictly recommended to use a Demo Account to take confidence with this trading technique.